
User Churn Analysis for a Streaming Video Startup
Project Description:
This project focuses on analyzing the user churn rate for a streaming video startup. The main objective is to gain insights into user churn behavior and provide valuable information for decision-making. The project involves several key tasks, such as determining the company’s operating duration, identifying different user segments, analyzing the overall churn trend since the startup’s launch, and comparing churn rates between these user segments.
The marketing department is particularly interested in comparing churn rates for users acquired through two distinct channels. To conduct the analysis, a dataset containing subscription data is used.
The dataset contains one SQL table, subscriptions. Within the table, there are 4 columns:
id– the subscription idsubscription_start– the start date of the subscriptionsubscription_end– the end date of the subscriptionsegment– this identifies which segment the subscription owner belongs to
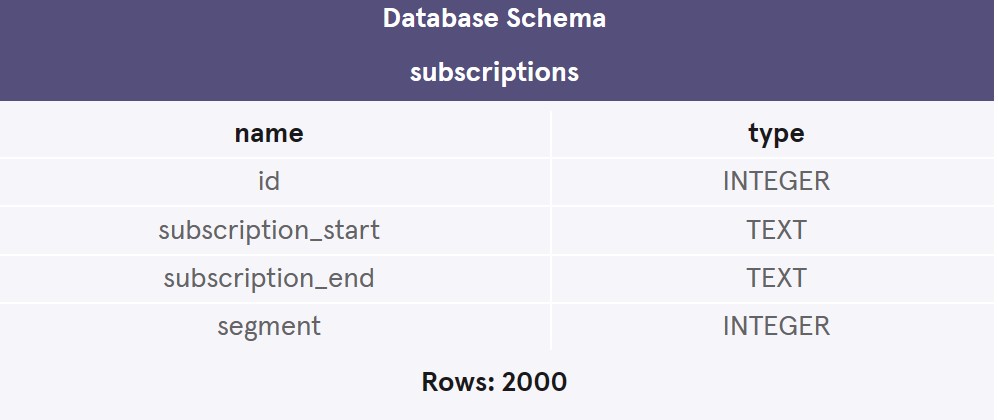
A minimum period for a subscription is 31 days, so a user can never start and end their subscription in the same month.
STEP 1: GLIMPSE OF DATA
An overall view of the data can be obtained by executing the code below.
 SELECT *
 FROM
 subscriptions
 LIMIT 20;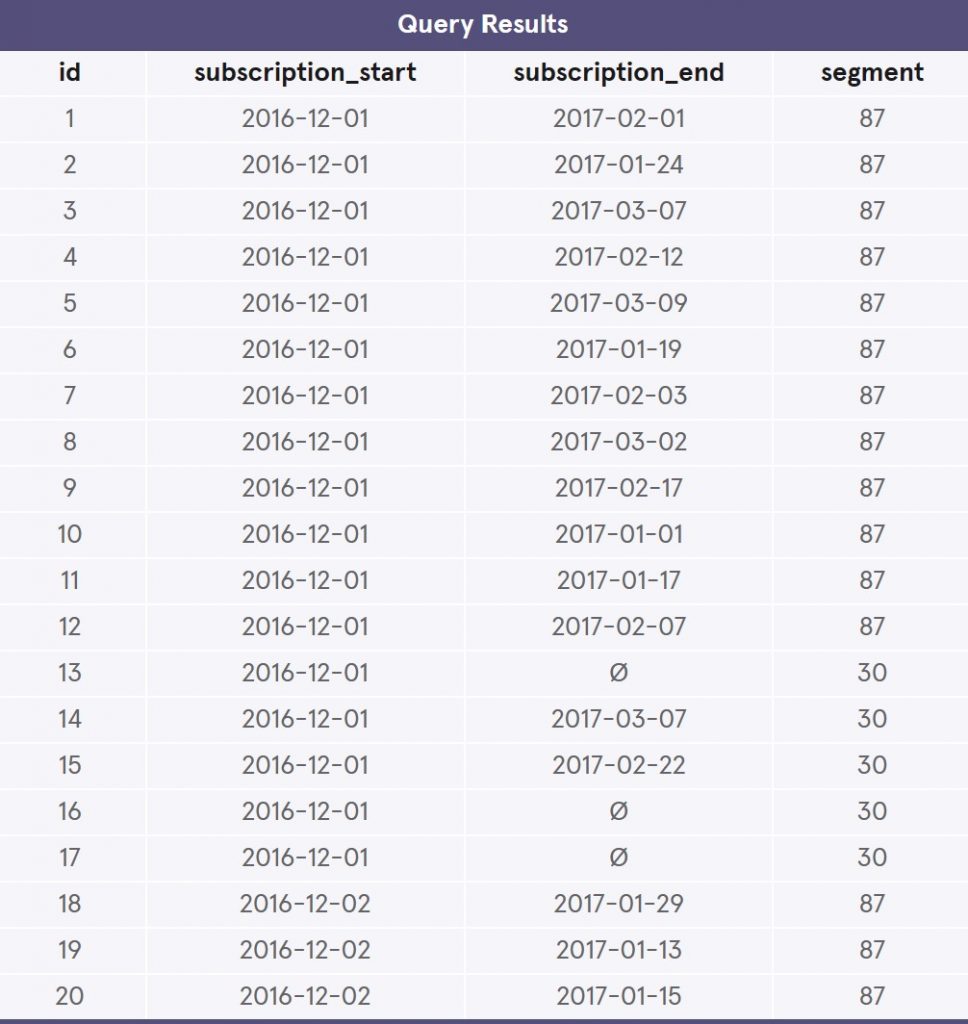
In this dataset, there are two segments for each user, 87 & 30.
STEP 2: RANGE OF MONTHS
In this step, the analysis will be conducted to determine the months for which churn calculations can be performed by running the code below.
SELECT
 MIN(subscription_start) AS min_start,
 MAX(subscription_start) AS max_start,
 MIN(subscription_end) AS min_end,
 MAX(subscription_end) AS max_end
 FROM subscriptions;

The churn rate for both segments (87 and 30) over the first 3 months of 2017 will be calculated (the churn rate cannot be calculated for December due to the absence of subscription_end values). To begin, a temporary table of months should be created.
STEP3: MONTHS
A subquery of months will be created here using the code below.
WITH months AS(
  SELECT
  '2017-01-01' AS first_day,
  '2017-01-31' AS last_day
UNION
  SELECT
  '2017-02-01' AS first_day,
  '2017-02-28' AS last_day
UNION
  SELECT
  '2017-03-01' AS first_day,
  '2017-03-31' AS last_day
)
SELECT *
FROM months;

The “months” table will be joined with the “subscriptions” table in the next step to create a new table that includes every combination of month and subscription. This joined table will be used to determine the status of each subscription in each month.
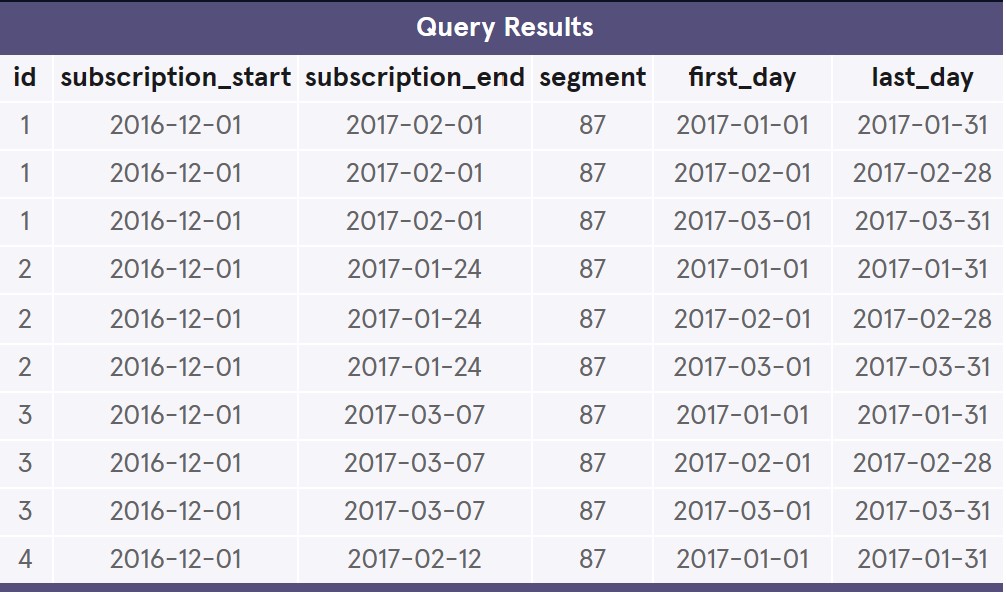
STEP4: CROSS JOINING
In this step, a temporary table named “cross_join” will be created by combining the “subscriptions” table with the “months” table. All columns from both tables will be selected here.
WITH months AS(
  SELECT
  '2017-01-01' AS first_day,
  '2017-01-31' AS last_day
UNION
  SELECT
  '2017-02-01' AS first_day,
  '2017-02-28' AS last_day
UNION
  SELECT
  '2017-03-01' AS first_day,
  '2017-03-31' AS last_day),

cross_join AS(
  SELECT *
  FROM subscriptions
  CROSS JOIN months)

SELECT *
FROM cross_join
LIMIT 10;
STEP5: STATUS
In continuation of the written code, in this step, a temporary table called “status” will be created from the “cross_join” table. The “status” table will include the following columns:
- “id” selected from the “cross_join” table.
- “month” as an alias for “first_day” column.
- “is_active_87” column created using a CASE WHEN statement to determine if users from segment 87 existed before the beginning of the month.
- “is_active_30” column created using a CASE WHEN statement to determine if users from segment 30 existed before the beginning of the month.
Then to the status temporary table, two columns named “is_canceled_87” and “is_canceled_30” will be added. These columns will have a value of 1 if the subscription is cancelled during the month and 0 if it is not cancelled.
WITH months AS(
  SELECT
  '2017-01-01' AS first_day,
  '2017-01-31' AS last_day
UNION
  SELECT
  '2017-02-01' AS first_day,
  '2017-02-28' AS last_day
UNION
  SELECT
  '2017-03-01' AS first_day,
  '2017-03-31' AS last_day
),
cross_join AS(
  SELECT *
  FROM subscriptions
  CROSS JOIN months
),

status AS(
  SELECT
  id, first_day as month,
  CASE
    WHEN segment = 87 AND
      (subscription_start < first_day)
      AND (
        subscription_end > first_day
        OR subscription_end IS NULL
      ) THEN 1
    ELSE 0
  END as is_active_87,

  CASE
    WHEN segment = 30 AND
      (subscription_start < first_day)
      AND (
        subscription_end > first_day
        OR subscription_end IS NULL
      ) THEN 1
    ELSE 0
END AS is_active_30,

    CASE
      WHEN segment = 30 AND
        (subscription_start < first_day) AND
        (subscription_end BETWEEN first_day AND last_day) THEN 1
      ELSE 0
    END AS is_canceled_30
  FROM cross_join)

SELECT *
FROM status
LIMIT 10;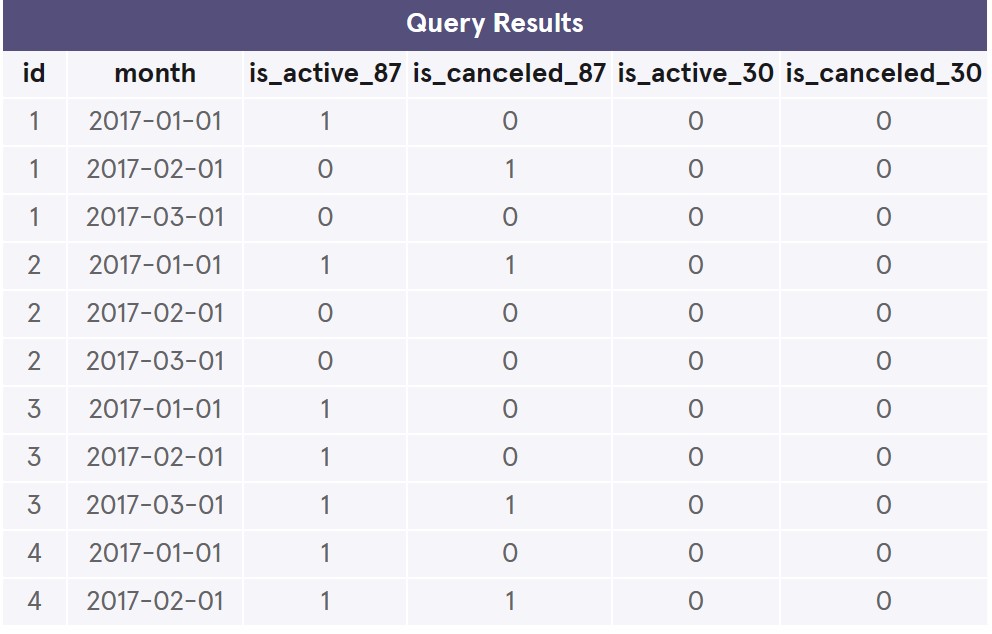
STEP6: STATUS AGGREGATION
A status_aggregate temporary table will be created, which will have columns for the sum of active and cancelled subscriptions for each segment and month. The resulting columns will include sum_active_87, sum_active_30, sum_canceled_87, and sum_canceled_30. This query enables the calculation of the number of active users within each segment during the specified period, bringing us one step closer to determining the precise numeric value of the churn rate.
WITH months AS(
  SELECT
    '2017-01-01' AS first_day,
    '2017-01-31' AS last_day
  UNION
  SELECT
    '2017-02-01' AS first_day,
    '2017-02-28' AS last_day
  UNION
  SELECT
    '2017-03-01' AS first_day,
    '2017-03-31' AS last_day),
cross_join AS (
  SELECT *
  FROM subscriptions
  CROSS JOIN months),

status AS (
  SELECT
    id,
    first_day AS month,
    CASE
      WHEN segment = 87 AND
        (subscription_start < first_day) AND
        (subscription_end > first_day OR subscription_end IS NULL) THEN 1
      ELSE 0
    END AS is_active_87,
    CASE
      WHEN segment = 87 AND
        (subscription_start < first_day) AND
        (subscription_end BETWEEN first_day AND last_day) THEN 1
      ELSE 0
    END AS is_canceled_87,
    CASE
      WHEN segment = 30 AND
        (subscription_start < first_day) AND
        (subscription_end > first_day OR subscription_end IS NULL) THEN 1
      ELSE 0
    END AS is_active_30,
    CASE
      WHEN segment = 30 AND
        (subscription_start < first_day) AND
        (subscription_end BETWEEN first_day AND last_day) THEN 1
      ELSE 0
    END AS is_canceled_30
  FROM cross_join),

status_aggregate AS(
  SELECT
  month,
  SUM(is_active_87) AS sum_active_87,
  SUM(is_active_30) AS sum_active_30,
  SUM(is_canceled_87) AS sum_canceled_87,
  SUM(is_canceled_30) AS sum_canceled_30
FROM status
GROUP BY MONTH)

SELECT * FROM status_aggregate
GROUP BY month;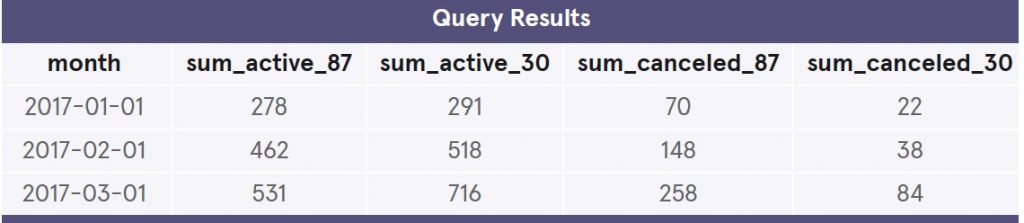
STEP7: FINAL STEP, FINAL CODE
The churn rates for the two segments will be calculated over the optimal calculated period.
WITH months AS (
  SELECT
    '2017-01-01' AS first_day,
    '2017-01-31' AS last_day
  UNION
  SELECT
    '2017-02-01' AS first_day,
    '2017-02-28' AS last_day
  UNION
  SELECT
    '2017-03-01' AS first_day,
    '2017-03-31' AS last_day),

cross_join AS (
  SELECT *
  FROM subscriptions
  CROSS JOIN months),

status AS (
  SELECT
    id,
    first_day AS month,
    CASE
      WHEN segment = 87 AND
        (subscription_start < first_day) AND
        (subscription_end > first_day OR subscription_end IS NULL) THEN 1
      ELSE 0
    END AS is_active_87,
    CASE
      WHEN segment = 87 AND
        (subscription_start < first_day) AND
        (subscription_end BETWEEN first_day AND last_day) THEN 1
      ELSE 0
    END AS is_canceled_87,

    CASE
      WHEN segment = 30 AND
        (subscription_start < first_day) AND
        (subscription_end > first_day OR subscription_end IS NULL) THEN 1
      ELSE 0
    END AS is_active_30,

    CASE
      WHEN segment = 30 AND
        (subscription_start < first_day) AND
        (subscription_end BETWEEN first_day AND last_day) THEN 1
      ELSE 0
    END AS is_canceled_30
  FROM cross_join),

status_aggregate AS(
  SELECT
  month,
  SUM(is_active_87) AS sum_active_87,
  SUM(is_active_30) AS sum_active_30,
  SUM(is_canceled_87) AS sum_canceled_87,
  SUM(is_canceled_30) AS sum_canceled_30
FROM status
GROUP BY MONTH)


SELECT month,
1.0 * sum_canceled_87 / sum_active_87 AS churn_rate_87,
1.0 * sum_canceled_30 / sum_active_30 AS churn_rate_30
FROM status_aggregate
GROUP BY month;

The analysis of the query results reveals that the churn rate for segment 30 has been fluctuating over time. However, there was a notable increase in the churn rate for both segments in March 2017, which raises concerns for decision makers. It is crucial for them to investigate the factors contributing to this problem in order to address the issue appropriately.
Additionally, the churn rate for customers in segment 87 has increased during the specified period. This suggests a considerable decline in the engagement level of segment 87. To retain this group of customers, new strategies should be devised and implemented.
STEP8: SUMMARY AND CONCLUSION
This project focuses on analyzing the user churn rate for a streaming video startup. The objective is to provide insights into user churn and assist the company in making informed decisions. The project involves determining the company’s operational duration, identifying user segments, analyzing the overall churn trend since the company’s inception, and comparing churn rates between user segments. By comparing churn rates for the two segments over a three-month period, the project aims to support data-driven decision makings in identifying areas for improvement and expansion to enhance user retention and drive business growth.
The analysis is performed using a dataset that includes subscription data for users acquired through two distinct channels. The dataset contains a SQL table called “subscriptions” with columns for subscription ID, subscription start and end dates, and the user segment.
The project follows a step-by-step approach:
- Data Overview: The provided code allows for an overall view of the data by displaying the first 20 rows of the “subscriptions” table.
- Determining Data Range: The code determines the range of months covered by the data, enabling churn rate calculations for the specified period.
- Creating a Temporary Table for Months: A temporary table called “months” is created to represent the months for churn rate calculations.
- Cross Join: A temporary table named “cross_join” is created by combining the “subscriptions” table with the “months” table, generating all possible combinations of month and subscription.
- Status Calculation: A temporary table named “status” is created from the “cross_join” table. It includes columns indicating the status of each subscription (active or cancelled) for each segment and month.
- Status Aggregation: A temporary table named “status_aggregate” is created, summarizing the total number of active and cancelled subscriptions for each segment and month.
- Churn Rate Calculation: Finally, the churn rates for the two segments are calculated over the specified period using the data from the “status_aggregate” table.
The results of the query indicate the churn rates for both segments and highlight fluctuations over time. It also draws attention to a significant increase in churn rate for both segments in March 2017, suggesting a potential issue that requires further investigation by the decision-makers. The findings emphasize the importance of addressing engagement levels for segment 87 and exploring new strategies to retain customers in that segment.